Graphing calculator with 2D and 3D.
Plot functions in seconds, compare several on one grid, and turn z = f(x, y) into a colourful 3D surface.
Included in Scientific Calculator RealMax · Scientific Calculator Pro
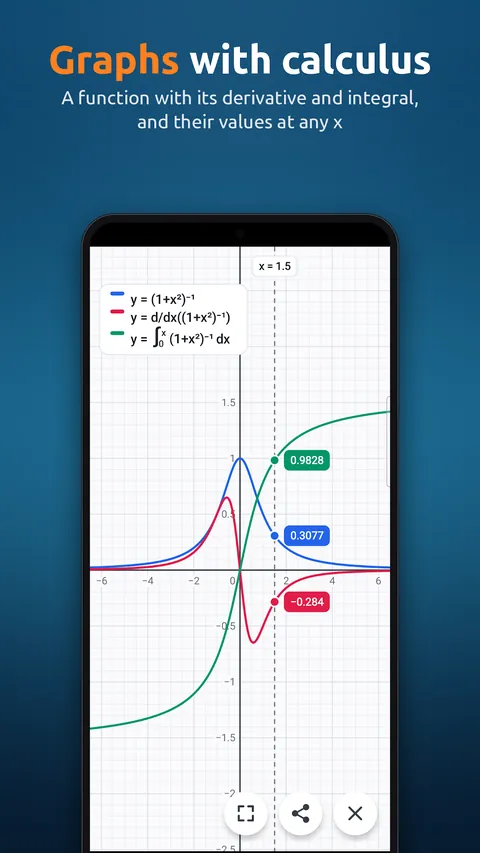
Switch to Graph mode, type a function and press =. RealMax draws it with points marked on the grid, so you can read values straight off the graph.
Plot several functions together by separating them with a colon, for example cos X : sin X. You can also graph a function with its derivative and integral to see how they relate, and plot 3D surfaces like z = sin x cos y with a colour height scale.
When you are done, share the graph to your notes, a classmate or your teacher.
Examples
How to use it in RealMax.
- 1Press MODE and choose Graphs.
- 2Type a function, for example cos X.
- 3To plot more than one, separate them with : (for example cos X : sin X).
- 4Press = to open the graph. Use the share button to send it.
Want more detail? Read the Graph mode guide →
Good to know.
Can I plot more than one function?
Yes. Separate the functions with a colon and RealMax draws them together on the same grid.
Does RealMax support 3D graphs?
Yes. You can plot z = f(x, y) as a 3D surface with a colour height scale.
Try the graphing calculator free
Download Scientific Calculator RealMax from Google Play. iPhone and iPad versions are coming soon.